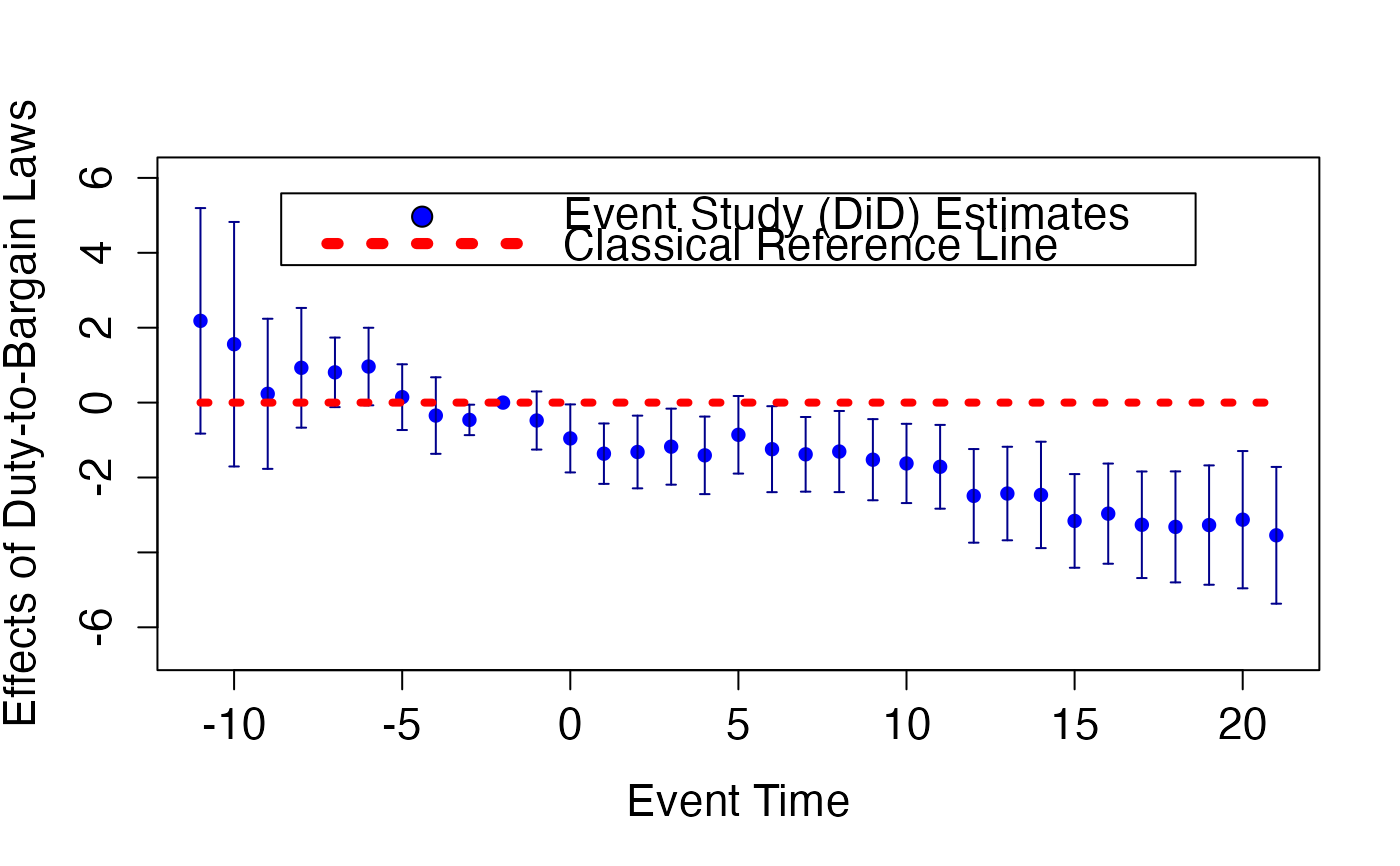
Classical event study plot
EventStudyPlot_Classical.RdThis EventStudyPlot_Classical function is to draw the classical event study plot with point-wise confidence intervals for event study coefficients.
Arguments
- object
an object of class
"fdid_scb". The object to be plotted.- pos.legend
a character value of "top" or "bottom" that indicates the position of legend. If NULL, the legend is not printed.
- scale.legend
a positive number that defines the size of legend. If
pos.legendis NULL, the value ofscale.legendis ignored.- ...
Additional arguments to be passed to
EventStudyPlot_Classical.
Value
The EventStudyPlot_Classical function returns a classical event study plot with point-wise confidence intervals for event study coefficients.
References
Fang, C. and Liebl, D. (2026). Making Event Study Plots Honest: A Functional Data Approach to Causal Inference. arXiv:2512.06804.